Hey, you again… Or hey, new here? Either way, welcome. The Duck That Quacks was about why a thinking partner helps at all. This time: how. Four stages, one stubborn bug, and a model that was wrong. A lot. And it still helped.
Here are the stages of investigation we’re gonna discuss today:
- Sip coffee: this is the stuck moment
- Ground the model
- Maintain the context
- After the output: use it, don’t adopt it
And for all four, the success condition is the same: I now have a better next move.
Let’s take it apart, with curiosity.
The story of one angry creator and her (not quite) saviour
Vektory is a desktop app I built as a portfolio project. It converts PNG images into SVG using the Potrace tracing algorithm. I wrote it to show how I think about architecture: how and why I make decisions. So every significant decision has its own ADR (architecture decision record). Remember that detail. It matters later.
At some point I ran Vektory on its own logo, for the app icon and the website.
And the icon looked small. In the Windows taskbar and the macOS Dock, it sat next to its neighbours like a younger sibling, and not in a good way.
The artwork itself was fine. But the SVG’s viewBox held extra empty space, and the operating system scaled that empty space along with the logo.
I’d seen the same symptom before, while helping a friend with design work. Back then I filed it under “fix when it matters.” Now it was my own logo, on my own app, so it finally mattered enough to fix.
So whatcha gonna do? Of course, try the obvious thing: cut the empty space. Find the bounding box of the path, fit the viewBox to it, done. Easy peasy, a one-evening fix, right?
Neh
It was not a one-evening fix. Every approach I tried, and every approach the model suggested, fixed one thing and broke another.
When you’ve worked on a product for a long time, being stuck doesn’t necessarily mean you lack information. You may have logs, screenshots, a user report and a decent understanding of the system. But you may have exhausted the explanations that came to mind. Maybe the next experiment will take an hour to prepare. Or maybe you’re simply tired, at the limit of your cognitive pool, and the investigation still has to move.
That’s where I was with the icon. The empty space was right there, I could see it. I just couldn’t get rid of it without breaking something else. Time to declare it: I have noooo idea what to do next.
Which means… we’re activating:
Stage 1: Sip coffee (and notice you’re stuck)
And this stage means I have tried every reasonable thing my brain has produced, and it has stopped producing useful new things. This is where I open a conversation with an LLM.
Though you don’t have to wait for a complete dead end, of course. But this moment shows best why you need a thinking partner at all: my explanations have run out, and the investigation hasn’t.
Stage 2: Ground the model
But before I ask anything, I have to decide what goes into that conversation.
Because you can start with something as vague as: “My icon looks smaller than the others.” It’s like asking someone who has no idea what you’re thinking about: “Hey, where’s the red one?” They’d look at you, confused, and ask a completely fair question: “The red what? And how would I know?”
Grounding means narrowing the model toward the real context of the investigation. I wrote about the mechanics in Grounding in LLMs. Here, let’s help the imagination instead.
The librarian

Now let’s take that “red one” to a library. A big one.
Imagine an enormous library. Hundreds of floors. It holds literature, history, psychology, biology, computer science and almost everything else people have written about.
Somewhere in the computer science section, there’s a shelf about graphics. Somewhere on that shelf, there are books about vector formats.
You walk up to the librarian and say: “I have a problem with an icon. It looks smaller than the others. What could it be?”
The librarian wants to help. Truly. And can’t say no to you really. But where should he start?
“Smaller” could mean the export resolution. The icon sizes each platform expects. Or the artwork itself.
So he makes a guess, walks to one of those shelves and brings you something. “Have you tried exporting at a higher resolution?”
Technically relevant. Completely useless! And you roll your eyes at the librarian, when actually you should be rolling them at yourself. Sorry to say it.
The problem isn’t that the library contains too little information. It contains far too much. And you don’t want the librarian to bring you everything. You’d run out of tokens, and probably out of a lifetime, before reaching the useful part.
So you start giving directions.
“This is a PNG-to-SVG converter built on Potrace.” “The traced artwork is correct.” “The SVG’s viewBox contains empty space around the artwork.” “The operating system scales that space along with the logo.” “The output also has to open correctly in design editors.”
Each detail removes shelves he no longer needs to search.
Then you hand over the SVG itself, or the code that builds the viewBox. You’re placing the actual material on his desk.
The library is what the model learned during training. The desk is the context available in this conversation. Grounding helps decide which part of that enormous library is relevant to the problem in front of you. It gives the model a better place to start looking.
It took me several restarts to get from “my icon looks smaller” to those directions. And suddenly we were talking about the same thing.
What goes on the desk?
- Project context: purpose, platforms and components.
- Problem description: the exact behaviour and the conditions.
- Observed facts, kept separate from hypotheses and assumptions.
- Tests already run, and their results.
- Direct evidence: logs, screenshots, code and documentation, when you have them.
The third line matters more than you’d think. “The icon looks smaller” is an observation. “The viewBox has empty space around the path” is also an observation, one level closer to the mechanism. “So I need to crop the viewBox” is already a hypothesis about the fix. Mix them up, and the rest of the conversation can quietly build on an assumption that has turned into a fact. As you’ll see in a moment, that’s exactly what happened.
Without code access, the model works inside your description of the system. That description has already passed through your attention, vocabulary and assumptions. If you leave out an important detail, the model can’t recover it by magic.
Well, actually, it can try. We have a name for that: hallucination. The model fills the missing part with a guess. And honestly, guessing is fine, we all do it. The problem starts when the guess shows up dressed as evidence. How to catch that deserves an article of its own.
What changes when the model can read the code?
With access to code, documents or logs, the model can inspect more direct evidence. That usually makes the conversation more specific. But don’t you dare assume the conclusion is automatically true.
Real names are persuasive. A wrong explanation built around actual libraries and functions can be harder to notice than a generic wrong one. The first few details check out, so the conclusion feels grounded.
flowchart TD
    A["Without code access<br/>your representation of the system<br/>+ evidence you provide"] --> L1["LLM"]
    B["With code access<br/>your representation of the system<br/>+ code and connected sources"] --> L2["LLM"]
    L1 --> H1["Candidate hypothesis"]
    L2 --> H2["More specific candidate hypothesis<br/>more specific ≠ verified"]
    H1 --> V["Experiment / source / human review"]
    H2 --> V
    V --> R["Verified conclusion"]

    classDef input fill:#dee3c6,stroke:#758879,stroke-width:1.5px,color:#2d2d30
    classDef llm fill:#ddc6e3,stroke:#7e7a8b,stroke-width:1.5px,color:#2d2d30
    classDef candidate fill:#e3d7c6,stroke:#8b7e7a,stroke-width:1.5px,stroke-dasharray:4 3,color:#2d2d30
    classDef verified fill:#c5e0cb,stroke:#758879,stroke-width:1.5px,color:#2d2d30
    class A,B input
    class L1,L2 llm
    class H1,H2 candidate
    class V,R verified
So code access changes what the model can inspect. It doesn’t change what counts as evidence. Especially in a complex system, the model can’t keep its focus on everything that might be important. If everything is important, nothing really is. You’re still the one who shows what matters and where to look.
Grounding gives the model a better place to start. But once the conversation begins, that context has to change with the investigation.
In my case, the easy answer was already sitting in my package.json: svg-path-bounds. A real library, already there as a transitive dependency, and it does what it promises. But for my problem it was wrong. Why? Let’s get to the next stage.
Stage 3: Maintain the context
Back to the librarian. Now he’s grounded in the problem. So what did he bring me?
First: compute the bounding box of the path and fit the viewBox to it.
No. Because Potrace outputs cubic Bézier curves, and a curve’s control points can lie outside the curve itself. A box around the control points is always at least as big as the real shape, usually bigger. The empty space got smaller, yes. But it was still there.
So: the bounds must come from the curve, not from its control points.
Second: move the viewBox to where the artwork actually is. Something like viewBox="131 96 400 300".
No. Because that’s spec-correct, and browsers render it fine. But Figma, Illustrator and Sketch may ignore the offset and misplace or clip the artwork. And a converter that breaks in design editors… well, that’s not a fix, that’s a new bug.
So: the viewBox has to start at 0 0.
Two wrong answers. But the conversation is moving. We’re not sitting under the table crying… anymore.
Every time you say “No, because…”, you have to finish the sentence. You make another constraint explicit. You notice which parts of the system you know, and which parts you have only assumed. Every “No, because…” adds another sheet to the desk.
Now put those two sheets next to each other. Bounds from the curve, not from the control points. A viewBox that starts at zero. Wait a second… this is basically the spec for the fix!
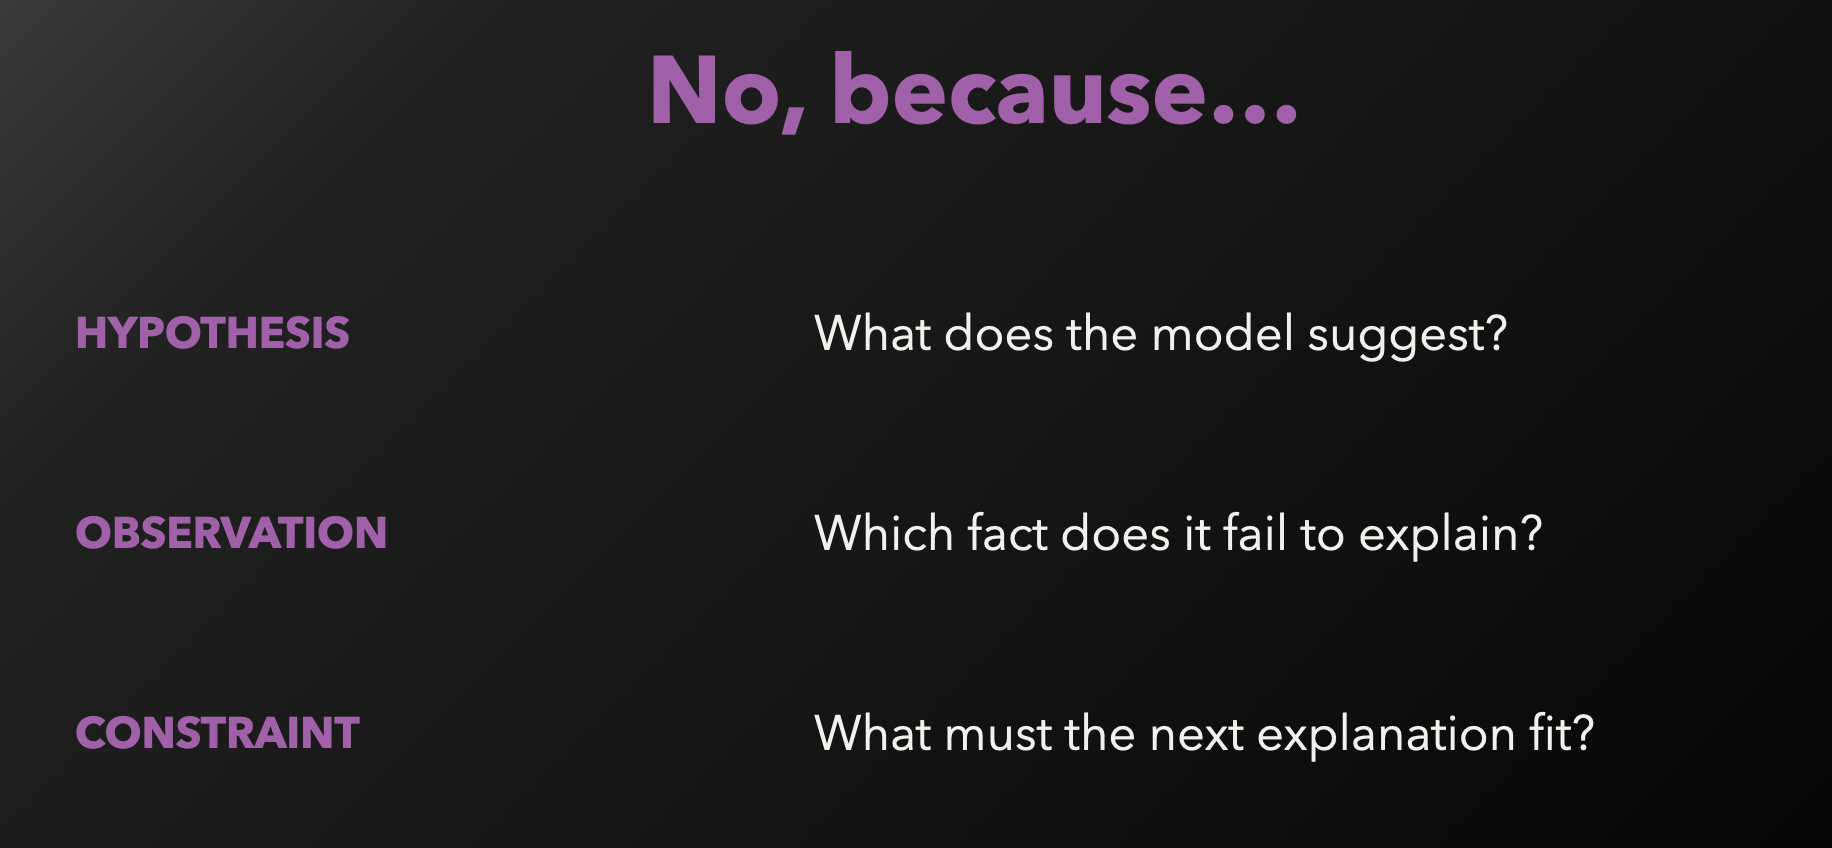
Sometimes the wrong answer is exactly what makes you say the thing you hadn’t said before. “Wait. Did I actually check that, or did I just decide it works that way?” That’s our quacking duck at work. Except this one has already suggested a version you now have to deal with.
One thing to keep in mind: write the constraint down precisely. “Cropping the viewBox breaks editors” is too broad, and it would have closed a direction that still worked. “A non-zero viewBox origin breaks editors” is precise. And it leaves room for a cropped viewBox that still starts at zero.
Lost in the middle
After a while, the beginning of the conversation is still visible. The latest message is visible, because I’ve just put it there. But the constraint that actually matters, the one I added forty minutes ago, is now somewhere in the middle.
It’s there, in the context. But being in the context and being used reliably are not the same thing. Research on long contexts calls this “lost in the middle”: models used information in the middle of a long context less reliably than information near the beginning or the end. Models have got much better at this since. But better is not solved, especially when the middle of your conversation is full of theories you’ve already rejected. I wrote more about why this happens in Context Window.
Clear the desk
At some point you need to clear the desk and rebuild its state. Usually in a new conversation, because the old one has accumulated too many dead theories and too much noise.
Write something close to this:
CONTEXT
The system and components involved.

OBSERVED FACTS
Only behaviour I have directly seen.

ALREADY TRIED
Each experiment and its result.

ASSUMPTIONS
Things I currently believe but have not verified.

QUESTION
What other explanations fit these observations?
Which variable am I treating as fixed?
What is the cheapest observation that would rule each one out?
The same goes for compaction. Before you continue after one, check that the summary kept the results of your experiments and the reasons you changed direction. If something needs to survive, put it in persistent project notes or an instruction file your tool reloads automatically (CLAUDE.md, AGENTS.md and the like), and keep it updated as you go.
And this is my own proof. Those chats are gone. Totally. But I can still tell you this story, because I wrote the ADR: what I saw, what I tried, why each attempt failed and what I chose. Without it, there would be no bug in this article at all.
The loop
Then the conversation becomes a loop:
- Let the model propose alternatives.
- Reject them when they conflict with the system, and write down why.
- Turn the surviving ideas into variables you can control.
- Choose the cheapest test that distinguishes between them.
- Use the model to create the commands, data or scaffolding for that test. I want to spend my time on the investigation, not on repetitive preparation.
- Run it against the real system.
- Update the facts, the tried list and the assumptions.
If the model starts repeating itself, stop. Reframe the problem. Repetition often means the description is missing something important, or the problem can’t be answered inside the current framing.
That’s an input too. Remember: we use the output as an input into our own reasoning.
Sometimes reframing means closing the chat altogether. In the same project, my icon in the browser kept showing up on a white background instead of a transparent one. The model and I went around in circles. In the end I found the fix myself, on Google. And that’s fine. Google is a partner too.
Stage 4: Use it, don’t adopt it
Eventually the question I keep asking myself came back: what am I currently treating as known?
I knew what a bounding box was. Of course I did. A rectangle around the shape.
Except that for a curve, “around the shape” and “around the points that define the shape” are two different rectangles. And I had been treating them as one. Familiar word, so the mechanism felt familiar too. Hello again, illusion of explanatory depth!
So I stopped asking the model for a fix and started asking it to help me understand. What exactly is the bounding box of a cubic Bézier? Where can a curve reach beyond the points it passes through? We went back and forth for a long time, reasoning through it step by step.
That’s the switch from The Duck That Quacks: not “complete this task,” but “help me understand a problem I haven’t fully defined yet.” As long as I was asking for a fix, I got fixes. With side effects, of course. And only when we actually started thinking together did we get to the math.
We ended up with three ways to get the real bounds:
| Approach | How | Verdict |
|---|---|---|
| Control-point box | A rectangle around all control points | Rejected: always at least as big as the true bounds |
| Sampling | About 100 points per segment | Rejected: even with 100 samples, the true extreme can fall between them, and it costs 100 evaluations per segment |
| Analytical | Find where the curve’s derivative is zero | Chosen: exact, at most 2 roots per axis, about 15 lines |
The analytical way works because, for each axis separately, x and y, the derivative of a cubic Bézier is a quadratic. And quadratics have a closed-form solution:
If the quadratic coefficient vanishes, solve the remaining linear equation instead. Keep only the roots strictly between 0 and 1, evaluate the curve there and at the endpoints, and you have the true extremes. And that’s it. No guessing.
And the editors? Solved by the second constraint, almost word for word:
<svg viewBox="0 0 W H">
  <g transform="translate(-x, -y)">
    <path d="..."/>
  </g>
</svg>
The viewBox starts at zero, so Figma, Illustrator and Sketch are happy. The content moves into place with a translate.
Then I checked it everywhere it had looked wrong: the Dock, the Windows taskbar, the website. The icon finally filled its frame. And I opened the SVG in Figma, Illustrator and Sketch, the editors that would have choked on an offset viewBox. All three placed it correctly (details in the ADR).
And if you’re a graphics developer reading this and thinking “well, that’s just Bézier extrema”… yes. Yes, it is. Honestly, none of the pieces were that hard on their own. The trap was that every fix looked right somewhere. The library with the perfect name was right there in my project, and its result was almost right. The viewBox by the spec worked just fine in the browser… and then broke in the editors. You only see the whole picture when you put the Dock, the taskbar and the editors side by side. Which nobody does for a one-evening fix, right?
Once you know that control points can lie outside the curve, it sounds obvious. Most bugs do.
But before that, “bounding box” was a word I’d stopped questioning. Somewhere between export settings, icon sizes and viewBox syntax, it was just one more thing that surely wasn’t the problem.
A thought becomes a test
This is the second half of role two from the previous article. The first role makes thought explicit. The second widens the space, and shortens the distance between a thought and a test.
flowchart LR
    A["Human<br/>chooses a variable"] --> B["LLM<br/>prepares test material"]
    B --> C["System<br/>produces an observation"]
    C --> D["Human<br/>updates understanding"]
    D -.->|"next variable"| A

    classDef human fill:#dee3c6,stroke:#758879,stroke-width:1.5px,color:#2d2d30
    classDef llm fill:#ddc6e3,stroke:#7e7a8b,stroke-width:1.5px,color:#2d2d30
    classDef system fill:#7c838e,stroke:#5a6f8f,stroke-width:1.5px,color:#f5f5f0
    class A,D human
    class B llm
    class C system
In my case, that meant test files. I asked the model to generate a handful of images built to break the naive approach: an S-curve whose control points stick far out of the shape, a logo placed far from the origin, an almost straight segment where the quadratic term nearly vanishes and the equation turns linear. The idea was simple: make the control-point box and the true bounds disagree, or hit an edge case. I ran them through Vektory and compared the output.
Oh Lord of Biases
If you’ve read a few of my articles, you’ve probably noticed I mention biases a lot. And I mean a lot a lot. And I’ll probably never get tired of it.
This bug had a whole collection. The illusion of explanatory depth, we’ve already met. Then confirmation bias: you notice what supports your idea and quietly skip what doesn’t. Every time the crop got a little closer, I saw “almost there,” when it was actually still broken.
And my favourite one: motivated reasoning. I wanted my easy peasy one-evening fix to work. Desperately. And when you desperately need your explanation to work, you’re not actually searching for the truth anymore. You’re searching for a way to be right!
And now add sycophancy, the model’s habit of agreeing with you. A model that tends to agree, plus you, desperately wanting to be right… That’s a very cosy loop. Run from it. Immediately.
But the same LLM can also help you catch yourself. Not by default, though. You have to set it up for that. Ask it to argue against you. Make it point out where you’re defending an idea instead of checking it. And watch your own questions: if the answer you desperately want is already sitting inside the question… well, you’ll get exactly that answer. That’s metacognition, thinking about your own thinking. And it deserves its own article, which I will definitely write.
If the output is not THE answer, what is?
Let’s define a useful output:
- a hypothesis you hadn’t considered;
- an obviously wrong hypothesis that makes you state a hidden constraint;
- a question that exposes missing information;
- a test matrix you wouldn’t have built manually, or would have built for far too long;
- a command that makes the next attempt cheap;
- an overconfident explanation that reminds you to open the source and check.
Get even one of those, and it was worth opening the chat.
LLMs don’t replace testing. They don’t replace experience. Experience is what lets you reject the plausible nonsense, choose a meaningful variable, notice the unexpected result and decide what evidence is strong enough.
What the model can change is the rhythm of the investigation.
The goal is never to trust the output. It’s to use it as an input into your own reasoning, and walk away with a better next move.
Sources
- Vektory: PNG to SVG desktop converter.
- ADR 0010: Tight SVG viewBox via cubic Bézier extrema.
- Rozenblit, L. & Keil, F. (2002). The misunderstood limits of folk science: an illusion of explanatory depth. Cognitive Science, 26(5).
- Sharma, M. et al. (2023). Towards understanding sycophancy in language models. Anthropic.
- Kunda, Z. (1990). The case for motivated reasoning. Psychological Bulletin, 108(3).
- Nickerson, R. S. (1998). Confirmation bias: A ubiquitous phenomenon in many guises. Review of General Psychology, 2(2).
- Liu, N. F. et al. (2024). Lost in the Middle: How Language Models Use Long Contexts. Transactions of the ACL, 12. Preprint 2023.